
The Engine Under the Hood: Why Your Indexed Product’s Performance Depends on Its Index
When you buy a car, you don’t just look at the paint job — you want to know what’s under the hood. A sleek chassis with a weak engine won’t win any races. The same is true for AI: the most sophisticated model is only as powerful as the chips that run it — Nvidia GPUs can unlock performance and scalability that competing CPUs have yet to match.
In the world of Indexed Universal Life (IUL) and Indexed Savings Plans, the “engine” is the underlying index. The product wrapper — whether it’s the Great Eastern Prestige Index Income, Manulife Signature Indexed Income, or TransAmerica Prospera FlexiGrowth Indexed Savings — is an important "chassis". But the index is what drives your credited returns.
This article focuses on three common “engines” powering such products:
- NASDAQ‑100 Total Return Index
- S&P 500 Total Return Index
- S&P 500 Engle Volatility Target 6% Index
We’ll explore how each works, their pros and cons, and how they’ve performed in the past 15 years, from 2010 to 2025.
Why the Index Matters
In an indexed product, your credited interest is linked to the performance of the chosen index, subject to caps, minimum crediting rates and participation rates. The insurer uses derivatives (eg. options) to hedge the index exposure, and the nature of the hedge depends on the index’s volatility.
- Higher volatility → usually balanced with lower caps/participation rates.
- Lower volatility → higher caps/participation rates.
But volatility isn’t the whole story — there’s another lever at play: index complexity.
- Many modern “engineered” indices — like volatility‑targeted strategies, multi‑asset blends, or those with embedded option overlays — are structurally less volatile, but the calculation method, the number of components, and the frequency of index rebalancing all add layers of intricacy. These can affect how complex it is for the insurer to replicate or hedge.
- An index engine with lower volatility should be paired with a higher participation rate — but this is not necessarily the case with Indexed Savings Plans because the complexity of the underlying index is also a determining factor.
That’s why two products with the same wrapper can deliver very different results depending on the choice of the index — the index is the performance engine.
Meet the Three Engines
1. NASDAQ‑100 Total Return (NDX TR)
- What it is: The 100 largest non‑financial companies listed on Nasdaq, heavily weighted toward technology, consumer services, and biotech.
- Strengths:
- Explosive growth driven by technology-led themes such as AI and tech-driven bull markets (eg. 2020, 2023).
- Exposure to innovation leaders like Apple, Microsoft, Nvidia.
- Trade‑offs:
- Concentration risk — top 10 stocks can make up over 50% of the index.
- Deeper drawdowns in downturns (–33% in 2022).
- Impact on caps: High volatility typically result in higher hedging costs, often balanced with lower caps in IULs.
2. S&P 500 Total Return (SPX TR)
- What it is: 500 large US companies across all 11 sectors.
- Strengths:
- Broader diversification reduces single‑sector shocks.
- Strong long‑term compounding.
- Trade‑offs:
- Less upside in narrow tech booms compared to NASDAQ‑100.
- Impact on caps: Moderate volatility supports moderate caps.
3. S&P 500 Engle Volatility Target 6% (SPX VT 6%)
- What it is: A rules‑based version of the S&P 500 that adjusts exposure daily to target 6% annualised volatility.
- Strengths:
- Smoother returns, smaller drawdowns (–5.4% in 2022).
- Often supports higher caps due to lower volatility.
- Trade‑offs:
- Lags in bull markets when volatility spikes and exposure is cut by the volatility control mechanism.
- More complex to explain — it’s not “the S&P 500” but a derived strategy.
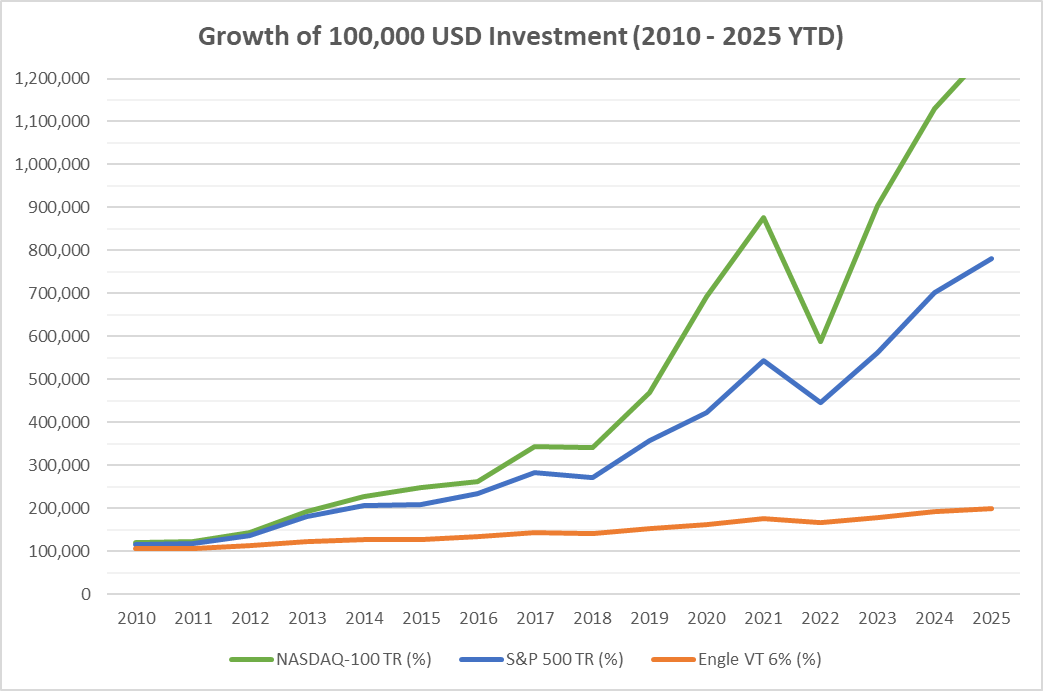
Growth of $100,000 (2010–2025 YTD)
The 0% Floor — Your Built‑In Safety Net
IUL and Indexed Savings Plans based on the above indices have one of the most important features — the 0% floor:
- If the index return for your crediting period is negative, your credited interest is floored at 0%.
- You don’t lose value from that year’s index performance (before fees/charges).
Example:
| Year | NASDAQ‑100 TR (%) | S&P 500 TR (%) | Engle VT 6% (%) | Credited Return with 0% Floor |
|---|---|---|---|---|
| 2018 | –1.04 | –4.38 | –1.39 | 0.00 |
| 2022 | –32.97 | –18.11 | –5.40 | 0.00 |
This means that in 2022, a direct NASDAQ‑100 investor saw a ~33% drop, but an IUL policyholder linked to NASDAQ‑100 with a 0% floor would have been credited 0% instead.
The following chart showing the back-tested/ historical performance of the same indices with the 0% floor and the applicable cap rates and participation rates:
- NASDAQ-100 TR with a cap rate of 8.5%,
- S&P 500 TR with a cap rate of 9%
- Engle VT 6% uncapped with participation rates of 90% and 60%
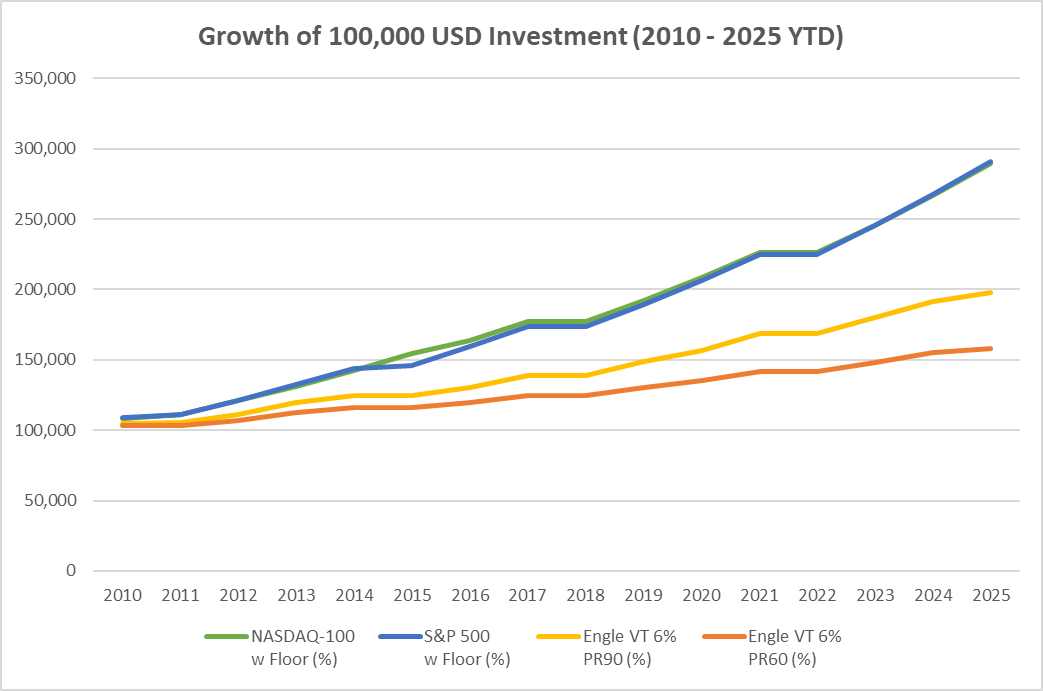
(Engle VT 6% are simulated back‑tests before their live inception, based on the S&P Global's published methodologies applied to historical S&P 500 futures data. Please see the Performance Disclosure at the end of the Engle 6% VT TCA Index document for more information regarding the inherent limitations associated with back-tested performance.)
Pros and Cons Summary
| Index | Pros | Cons | Annualised Return (2010 to 2025 YTD) |
|---|---|---|---|
| NASDAQ‑100 TR | Highest growth potential in tech; innovation exposure | Highest volatility; deeper drawdowns; lower caps | 6.8% |
| S&P 500 TR | Broader diversification; strong long‑term record | Less upside in narrow tech rallies | 6.8% |
| Engle VT 6% | Smooth returns; smaller drawdowns; uncapped | Lags in bull markets; more complex | PR90: 4.4%, PR60: 3.0% |
Understanding Volatility-Targeted Indices (VTIs)
Many synthetic indices, like those from Engle, use volatility-control algorithms to smooth out market swings. While this helps reduce risk, it also quietly lowers your exposure to market gains.
What You Should Know:
- Lower volatility targets = lower exposure to index = lower potential returns.
For example:
- If the index volatility is 16% but the target is 8%, your actual exposure may be just 50% of the underlying index.
- Combine that with the insurer’s announced participation rate (say, 60%), and your effective participation becomes just 30% (60% x 50%).
- So if the index returns 12% in a given year, you might only get 3.6% even though the product says “uncapped”.
Comparison:
| Index Type | Cap/Limit | Effective Return (Potential) |
|---|---|---|
| Vanilla Index | 9% Cap | 9% |
| Volatility-Targeted Index | Uncapped | 3.6% |
Bottom Line:
Volatility control can protect the insurer from big drops — but it also quietly limits your upside. Always look beyond the headline participation rate to understand what you’re really getting.
Which Engine Fits Your Drive?
- Max speed, high risk: NASDAQ‑100 TR — for those who want to chase the fastest growth and can accept lower caps and bigger swings.
- Balanced performance: S&P 500 TR — a reliable all‑rounder with broader exposure.
- Smooth ride, uncapped: Engle VT 6% — for those who value stability and uncapped but willing to accept lower performance.
Remember: the chassis (product) matters, but the engine (index) determines how far and fast you can go.
Product Snapshots
Great Eastern Index Income
- Offers index‑linked crediting with 0% floor.
- Index options: Engle VT 6% uncapped.
- Typical participation rate between 60% to 90%.
Manulife Signature Indexed Income
- Focus on long‑term income potential, with 0% floor.
- Index options: S&P 500 with 9% cap.
- Guaranteed participation rate of 100%.
TransAmerica Prospera FlexiGrowth Indexed Savings
- Indexed savings plan with flexible premium options, with at least 2% p.a. guaranteed crediting rate.
- Index options: NASDAQ‑100 (capped at 8.50%) and S&P 500 (capped at 8.20%), or combination.
- Guaranteed participation rate of 100%.
(Product features as at 28 Aug 2025.)
Conclusion — Choose the Right Engine for Your Journey
For IULs and Indexed Savings Plan, performance starts with the engine. In these products, the underlying index is that engine — shaping not just potential returns, but also influencing the caps, participation rates, and the ride you experience along the way.
The NASDAQ‑100 offers raw speed and the thrill of innovation‑driven growth, but with sharper turns. The S&P 500 delivers balanced, broad‑based power that’s easier to handle in most market conditions. The S&P 500 Engle VT 6% trades with stability, smoothing the journey.
And thanks to the 0% floor, products based on all these indices let you avoid locking in losses in negative years — a built‑in safety net that can make the ride far less nerve‑wracking.
In the end, the “best” engine isn’t the same for everyone — but it is an important decision. Because it directly shapes performance, it can be the difference between achieving the lower end or higher end of your policy’s projections. Most importantly, it will influence whether you reach your long‑term financial goals.